Expérience
IAP – Instrument Analyseur Plasma
IAP Experiment – Plasma Analyser Instrument
1- Scientific Objectives.
The objective of the IAP experiment is to
characterize the state of the ionospheric plasma, in
order to detect perturbations that may be associated with seismic activity and
to provide the plasma parameters that are needed to analyze the data from the
plasma wave instruments, ICE and IMSC. As a secondary objective, near real time
ionospheric data can be provided for space weather
purposes.
Over
the last two decades, a number of publications have dealt with the detection of
ionospheric perturbations associated with the Earth's
seismic activity, most of them related to effects following earthquakes, but a
few of them describing also pre-seismic events. Initial studies used
ground-based measurements such as ionospheric
sounders or incoherent radars. More recently, satellite experiments have
brought a rapidly growing number of interesting observations, giving in
particular access to Total Electron Content (TEC) measurements deduced from the
analysis of GPS data or from beacon satellite transmitters. In many cases,
however, not only the analysis of the phenomena but even their characterization
have proved to be difficult due to the weakness of the effects, the relative
paucity of observations and hence their subsequent lack of statistics and the
difficulty of removing natural signals that can mix with, and indeed sometimes
mask, those induced by seismic activity.
Dedicated
in-situ measurements of the ionospheric plasma, with
nearly permanent observations along the orbit, and correlated TEC measurements
on dense networks of stations will very significantly add to the earlier
observations. They will improve the description of the phenomena and allow a
better understanding of the underlying physical mechanisms through data
assimilation in ionospheric models.
The
aim of the IAP experiment is thus to measure the ion composition, density,
temperature and bulk velocity with a
time resolution up to ~ 360 ms and the ion density fluctuations up to ~ 160 Hz.
2- Description of
the experiment.
Following
the concept proposed by W.B. Hanson [Hanson, W.B. and R.A. Heelis, Techniques for measuring bulk gas motions from
satellites, Space Sci. Instrum.
1, 493-524, 1975], the IAP experiment makes use of two analyzers: APR (for Analyseur à Potentiel Retardateur, Retarding
Potential Analyzer) performs the energy analysis of the rammed ionospheric ions and ADV (for Analyseur
pour Direction de Vitesse, Velocity Direction
Analyzer) determines the average angles of arrival of the ions. APR
measurements allow to determine the density,
temperature and bulk energy of the ionospheric ions.
Along the ~ 700 kilometer altitude circular orbit of DEMETER, the ion species
of interest are H+, He+ and O+ and, in periods
of magnetic storms and at high enough latitudes, the molecular ion group N2+,
NO+, O2+. ADV provides the direction of the
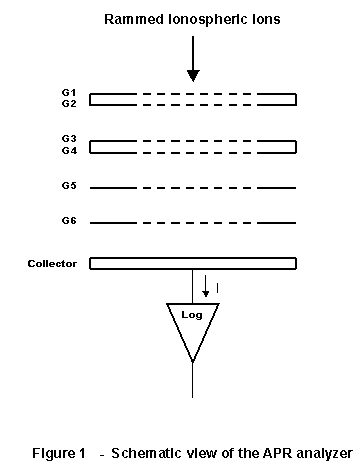
ram velocity vector. Schematic diagrams showing the principle of operation of the
two analyzers are given in figures 1 and 2.
2.1- APR
analyzer.
Ions
travel through the APR analyzer through several high transparency grids. The
first two grids, G1 and G2, at ground potential, shield the plasma from the
potentials applied to the other grids inside the analyzer, thus preventing any
disturbance of the ion trajectories before they enter the instrument. The
double grid G3 + G4 is used to perform the energy analysis of the incoming ions
through the applied retarding potential VGR. VGR is swept between a lower and
an upper limit which lie in the range 0, +22V. The values of these lower and
upper sweep voltages depend on the IAP specific mode of operation and are
controlled by telecommand

Grids G5 and G6 are
polarized at fixed potentials of 0V and –12V respectively. The negative voltage
on G6 prevents photo-electrons or auroral electrons
with energy lower than 12 eV to reach the collector.
It also repels photo-electrons emitted by the collector when submitted to UV
fluxes from the Sun, or fainter sources such as the geo-coronna
or the auroral neutral atmosphere, which, otherwise,
would represent a source of parasitic currents. In addition, G5 and G6, which
are maintained at fixed voltages, act as an electrostatic shield to suppress the
capacitive coupling between the double grid G3 and G4 and the collector, preventing
strong disturbances on the current measured by the collector due to the sweep
in potential of G3 + G4.
2.2- ADV
analyzer.
Figure 2a displays a schematic view of the principle
of operation of the ADV analyzer.

The first two grids G1, at ground potential, and G2,
at a fixed potential V2, shield the external plasma from the potentials applied
on the various grids internal to the analyzer. The potential V2 is controlled
through telecommand and can be given 2 values, 0V or
+2V. In the first case all ions entering the instrument can get access to the
collector. In the second case H+ ions are repelled due to their low
ram energy and ADV essentially measures the direction of the bulk velocity of
the. major heavy ions O+. As explained
below, this allows to measure the ion bulk velocity
direction with a better accuracy. Grids G3 and G4 act as a diaphragm, the
dimension of which controls the transfer function of the analyzer. Grids G5 and
G6, at ground potential, shield ions admitted through the diaphragm from the
influence of the –12V voltage applied to G7. This last grid, which plays the
same role as grid G6 in APR, prevent external electrons with energy less than
12 eV from reaching the collector and also repel the
photo-electrons created on the collector by UV illumination.
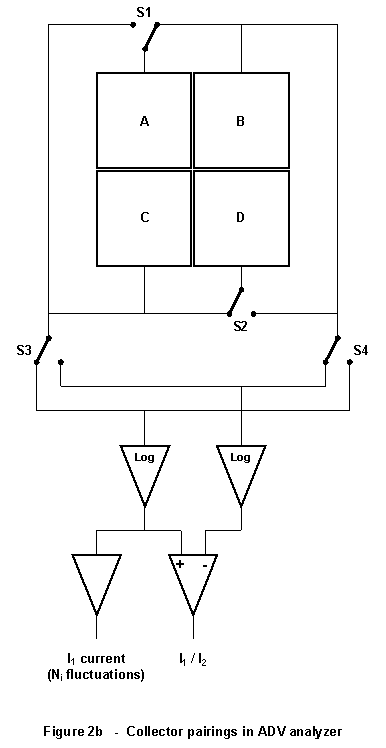
The ADV collector is divided in 4 insulated
quadrants, as shown in figure 2a. These 4 quadrants can be associated in pairs
by means of high insulation switches in order to define two identical half
collectors symmetrical either with respect to the X axis, when the associated
quadrants are C1=A+B and C2=C+D, or with respect to the Y axis, when the
associated quadrants are C1=A+C and C2=B+D. Simple analytical calculations show
that the ratio I1/I2 of the ion
currents falling on C1 and C2 in the first (respectively second) configuration
is a function of the angle of the ion ram velocity with respect to the XZ (respectively
YZ) plane. To reach the desired accuracy for the APR
transfer function relating current ratios to velocity angles, a numerical
computation of the ion collection by C1 and C2, has been performed using a
detailed geometrical model of the instrument. Using this calculated transfer
function and the measured ratio I1/I2,
it is therefore possible to determine the two angles that define the direction
of the ram velocity. In addition to measuring the I1/I2 current ratio,
the instrument electronics also allows to measure directly the current I1 collected by C1.
Combining this latter measurement and the measured current ratio allows to determine the total ion current falling on the ADV
collector and its temporal variations from which one can get access to the
density variations along the orbit with an excellent temporal/spatial
resolution of 6.4 ms in burst modes. Due to their higher Mach number, heavy
ions such as O+ are more focused at the entrance of the instrument than
H+ ions and the corresponding ratio I1/I2 displays a
sharper variation as a function of the angle of the ion bulk velocity with
respect to the normal to the instrument. ADV measurements are thus more accurate for heavy
ions only than when H+ is present. This is the reason to prevent H+
ions to reach the collector when one has to measure very the small plasma
velocities that are expected at mid latitudes.

2.1- Electronics.
Both
analyzers include their respective front ends electronics, consisting of a
single 4 decade logarithmic amplifier (10-11 A to 10-7 A)
for APR and two 2 decade logarithmic amplifiers (10-10
A to 10-8 A) followed by a difference amplifier for ADV with also
the necessary set of high insulation switches. In order to correct for
possible variable offsets of the ADV logarithmic amplifiers, the I1 and I2
inputs are periodically interchanged. The noise level of the APR current
measurements is about 10-13 A and the relative error on the I1/I2 ration of about 0.1%.
The
rest of the electronics, which includes the swept voltage VGR generator, the
ADC's and the FPGA used to command and control the operation of the instrument
and interface the instrument with the scientific payload DPU, is integrated on
a circuit board housed in the BANT module.
APR
data are digitalized on 16 bits, ADV current ratio data on 12 bits and the C1
current from ADV on 16 bits.
2.4- Modes of
operation.
The
various modes of operation of IAP differ by the numbers of steps to sweep the
VGR potential and the duration of each step. Sub-modes of APR differ by the
minimum and maximum values of the VGR sweep. The single APR output and the two
ADV outputs are sampled at each step of the VGR voltage.
IAP
has 2 modes of operation in the DEMETER Survey mode, respectively labeled
Survey 1 and Survey 2. Survey 1 corresponds to a medium energy resolution mode
for APR with 28 VGR steps 12.8 ms long providing a complete set of plasma
parameters every ~ 360 ms. Survey 2, with 56 VGR steps 12.8 ms long,
corresponds to a high energy resolution mode with a lower temporal resolution
providing a complete set of measurements every 720 ms. Density fluctuations
from ADV measurements are available with a time resolution of 12.8 ms.
There
is only one mode of operation in the DEMETER Burst mode, featuring high energy
and high temporal resolution with 56, 6.4 ms long, VGR steps providing a
complete set of plasma parameters every ~ 360 ms.
Density fluctuations are available with a time resolution of 6.4 ms.